Ultrasonic Microscopy
Applied Optics Group, School of Electrical & Electronic Engineering, University of Nottingham
Introduction
The Ultrasonic Microscopy section within the Applied Optics Group has been established for several years, and its work is broadly split into two areas: developing the instrumentation to perform novel rapid non-contact ultrasonic imaging techniques for material analysis, and using the instruments to study the interaction between the propagating acoustic waves and the material.
The O-SAM
The Group has developed a laser ultrasound imaging system called the O-SAM (Optical Scanning Acoustic Microscope) which is capable of rapid, high resolution, non-destructive vector contrast imaging of surface acoustic waves (SAWs) without any measurement perturbation, damage or contamination of the sample surface.
SAW animation: MPEG | QuickTime.
The O-SAM uses two lasers to excite and detect the SAWs.
The first figure shows is a schematic of the O-SAM instrument. The SAW excitation source (shown in red on the diagram) is a Q-switched mode locked Nd:YAG laser. This has a fundamental frequency of 82MHz, and harmonics extend to the GHz region. Laser radiation from this laser is reflected off a spatial light modulator (SLM), and the 512x512-pixel image is imaged onto the surface of the sample. This SLM image is the source of the acoustic waves, and would typically be a concentric set of arcs. The separation of the arcs is set to be the same as the SAW wavelength at the desired frequency of excitation (for example 82MHz) for the material under investigation - this of course depends on the material velocity (velocity = frequency x wavelength).
If the SLM image is a set of concentric arcs, then the SAWs will propagate to a focal region. It is here that the SAWs are detected, using a modified optical beam deflection (”knife edge”) technique.
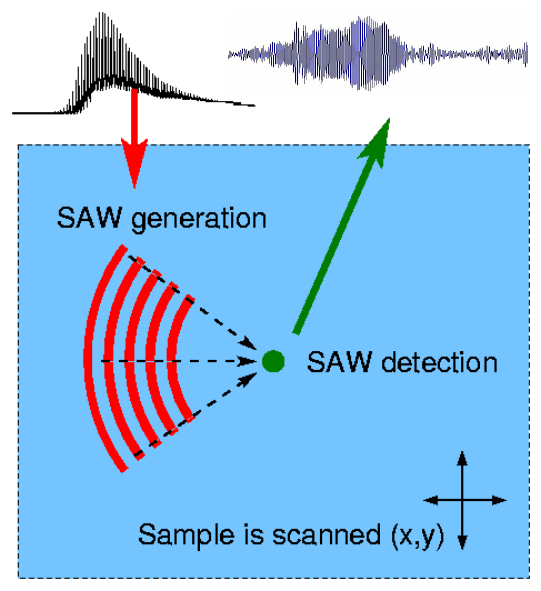
The second figure illustrates the geometry of the acoustic wave propagation in the O-SAM system. In its normal configuration, the SAW excitation image (from the SLM) and the detection point are kept fixed, and the sample is raster-scanned to produce c-scan images. It is also possible to scan keep the sample and excitation source fixed and to scan the detection point. This allows us to observe the surface acoustic waves as they propagate along the sample surface.
The O-SAM instrument is somewhat unique in terms of laser ultrasound systems in that it uses several novel techniques to improve the signal-to-noise ratio of the detected acoustic signal, in order to perform rapid high resolution scanning. Firstly, the laser energy used to excite the ultrasound is spread out over the sample surface (rather than just a point- or line-source) in a way that allows all the energy to contribute to the amplitude of the SAWs, i.e. a set of fringes matched to the wavelength of the acoustic waves on the sample. This allows more laser energy to be used, without ANY damage to the sample. Secondly, the acoustic waves are focused - as well as increasing the acoustic amplitude, this localises the acoustic interaction with the material. Due to the increased signal-to-noise ratio, the SAWs can be detected using an analogue detection technique. This involves mixing the detected signal - which may be at several hundred MHz - with a coherent reference signal in quadrature. The real and imaginary components of the complex amplitude can then be acquired extremely rapidly, from which the amplitude and phase of the acoustic waves at a given frequency can be determined. With a laser Q-switch repetition rate of around 1kHz, this represents an enormous speed-up in the acquisition of high frequency SAWs, enabling rapid high resolution imaging.
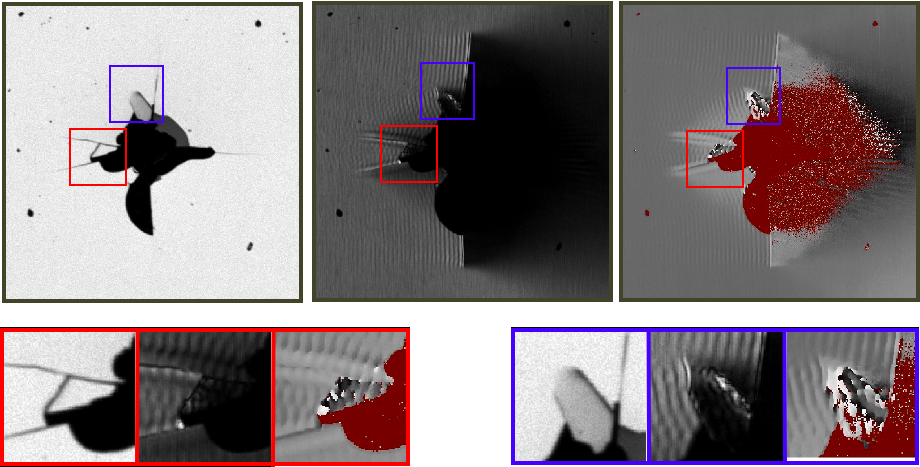
The images shown illustrate the imaging capabilities of the O-SAM. The large images are 1x1mm c-scans of a defect on a sample of aluminium-coated glass. On the left is an optical image (also acquired with the O-SAM instrument). To the right of this are amplitude and phase c-scans, of 82MHz SAWs. The SAWs are propagating from left to right, and classic interference fringes are observed where the forward propagating waves interfere with backward propagating waves which have been reflected off a shallow crack. The area of dark red in the phase image represents an area where the the signal amplitude is so low that the phase cannot accurately be determined. Below the three main images are details, illustrating the instrument’s high resolution imaging capabilities.
The Effects of Material Microstructure
Although the O-SAM is clearly capable of acquiring impressive c-scan images, problems occur when propagating acoustic waves through materials consisting of random microstructure. This tends to aberrate the wavefront as it propagates.
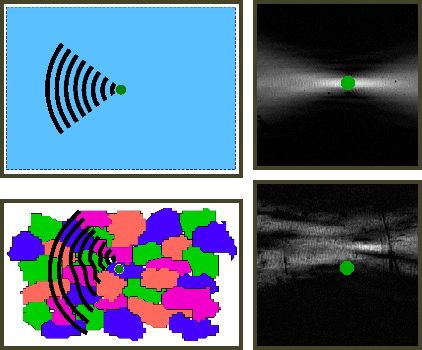
The effect of this is illustrated in the figure above. Instead of the acoustic waves propagating to a geometric focus as expected, they are distorted. The focus may be displaced and lose its integrity. The acoustic energy is no longer focused at the point at which the detection of the SAWs takes place (denoted by a green circle in the figure), and as well as image degradation, this has important implications in non-destructive testing applications because the acoustic energy is no longer probing the intended parts of the material. The “signal drop-out” does not occur due to attenuation or scattering, rather because the acoustic energy has been displaced.

The figure above illustrates the effect that material microstructure can have on our c-scan images. On the left is an unaberrated SAW amplitude image of a sample, where the dark fringes represent interference between two Lamb wave modes on a thin region of the sample. On the right is an image of the same sample, where the distance between the acoustic source and detection region has been increased, leading to greater aberration. The image is much more difficult to interpret due to the presence of acoustic speckle.
Adaptive O-SAM
To correct for the deleterious effects of material microstructure, we require knowledge of the effects of the aberrations, and a method of adjusting the excitation profile to correct for them. A second instrument, the Adaptive O-SAM, is being developed to do this. The principle of the system is shown below.
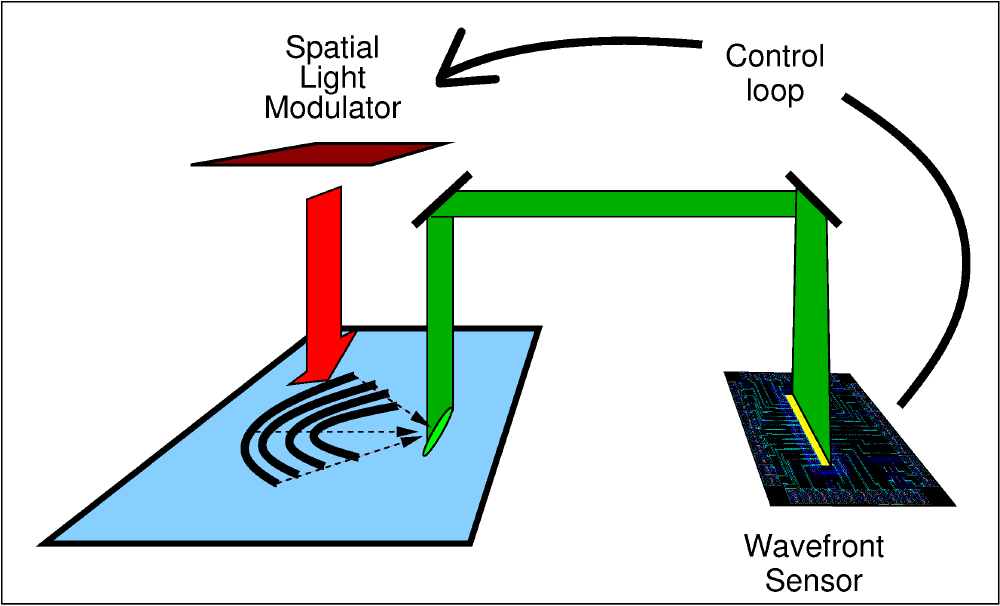
The use of an SLM to generate an excitation profile allows us to modify the acoustic source arbitrarily, affording an excellent degree of control - see a movie demonstrating the control of the acoustic field: MPEG | QuickTime.
The acoustic wavefront sensor (WFS) replaces the single point detector shown in the very first figure. This is an array of split photodiodes, and this array simultaneously detects the acoustic wavefront at several points across the intended acoustic focus region. The information acquired from the sensor can be used to adjust the acoustic excitation source (the SLM image) to correct for the effects of material aberration.
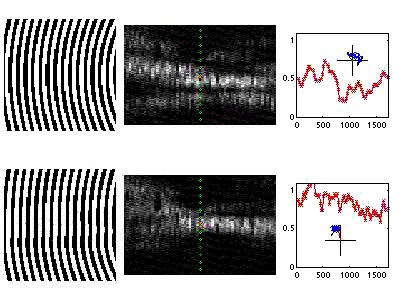
The image above illustrates aberration correction. In the upper half of the image, an “ideal” excitation source - a set of concentric arcs - is imaged onto the sample. This produces the aerial point spread function (PSF) shown in the middle. The sixteen green points in the centre of the aerial PSF indicate the 16 channels of the acoustic WFS. The graph on the right illustrates the relative amplitude and phase of the central point over a scan line nearly 2mm long. The lower half of the image illustrates aberration correction; see also a movie of the changes in the excitation source and the aerial PSF as the sample is scanned: MPEG | QuickTime.
Work on the Adaptive O-SAM is on-going.
Other Work
The examples shown are just a small part of the work undertaken by the researchers working within the field of ultrasonic microscopy in the Applied Optics Group. Emerging research includes using the statistical properties of observed acoustic aberration to ascertain statistical material properties such as grain size and degree of anisotropy. Non-linear ultrasonics is an area being actively pursued, and we hope to be able to demonstrate the detection of intrinsic material non-linearities in the near future.
Selected Publications
M Clark, S D Sharples, and M G Somekh, ‘Fast all-optical Rayleigh wave microscope: Imaging on isotropic and anisotropic materials,’ IEEE Transactions on Ultrasonics, Ferroelectrics and Frequency Control, vol 47, no 1, pp 65–74, 2000.
M Clark, S D Sharples, and M Somekh, ‘Laser ultrasonic microscopy,’ Materials Evaluation, vol 60, no 9, pp 1094–1098, 2002.
S D Sharples, M Clark, and M G Somekh, ‘Dynamic higher-order correction of acoustic aberration due to material microstructure,’ Applied Physics Letters, vol 81, no 12, pp 2288–2290, 2002.
S D Sharples, M Clark, and M G Somekh, ‘All-optical adaptive scanning acoustic microscope,’ Ultrasonics, vol 41, no 4, pp 295–299, 2003.
S D Sharples, M Clark, and M Somekh, ‘Surface acoustic wavefront sensor using custom optics,’ Ultrasonics, vol 42, p 647–651, 2004.