Difference between revisions of "SRAS for materials characterisation"
(→Determining the material elastic constants) |
|||
| (3 intermediate revisions by the same user not shown) | |||
| Line 61: | Line 61: | ||
==Determining the material elastic constants== | ==Determining the material elastic constants== | ||
| − | More recently, this approach has been | + | More recently, this approach has been dramatically expanded to allow the simultaneous determination of both the crystallographic orientation and elastic constants. Many engineering metals are polycrystalline; as such, the elasticity, crystalline orientation and grain distribution are cardinal factors in determining the physical properties of the material. However, the elasticity remains a more difficult parameter to measure and is rarely measured because the existing techniques are slow and cumbersome, with most current techniques requiring the laborious growth or destructive isolation of single crystals. By exploiting the global nature of the elasticity we can combine SAW velocity measurements from multiple grains to allow the determination of the single-crystal elasticity matrix (cij) and the crystallographic orientation of each grain. The process of determining both crystalline parameters is outlined in the figure. |
| + | |||
| + | {|align="center" | ||
| + | |[[File:Elastic constants method.png|600px]] | ||
| + | |} | ||
<br style="clear:both" /> | <br style="clear:both" /> | ||
Latest revision as of 16:38, 9 January 2022
What is SRAS?
|
|
Here is a link to a YouTube video where we describe what SRAS is, talk about some of the applications, and show the instrument taking measurements.
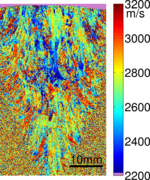
SRAS stands for Spatially Resolved Acoustic Spectroscopy, it is a technique for mapping the surface acoustic wave velocity of a material. The technique is analogous to optical spectroscopy techniques where analysis of the optical spectrum and the wavelengths that are most readily transmitted or absorbed tells us some properties of the sample being examined. In the acoustic sense we monitor the spectrum of sound waves emitted from a grating source. The technique can be performed two ways, the first is to use a fixed frequency source and sweep the grating spacing or the grating period can be fixed and the frequency is swept.
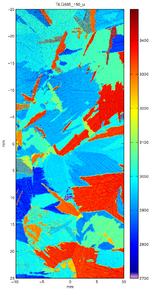
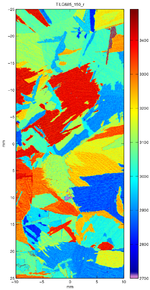
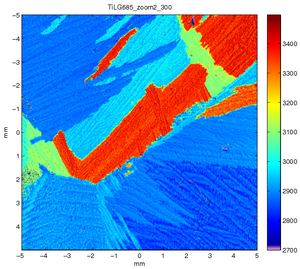
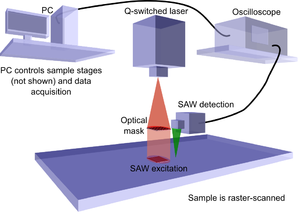
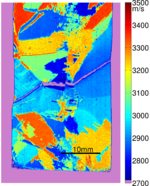
To measure the acoustic spectrum at each point on the sample a fixed grating is illuminated with a short laser pulse (typically ~1ns). As the laser pulse contains a broad range of frequencies, only the frequencies which match the grating spacing and acoustic velocity of that sample point will be generated. We measure the waves that have been generated close to the excitation region (see top figure). We can then calculate the frequencies generated and with the knowledge of the grating spacing we can obtain the acoustic velocity using v = fλ. If the sample is raster scanned we build up a detailed image of the sample velocity for that propagation direction. These images show the grain structure of the material and are very useful for material scientists for assessing the properties of the material.
EMDA Sponsored Instrument
|
|
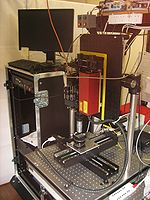
The EMDA instrument is the most advanced version of SRAS instrumentation we have at Nottingham. This instrument has been developed to provide rapid surface wave velocity imaging on a variety of surface finishes.
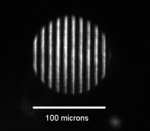
The instrument uses the fixed grating approach where a pattern of light and dark stripes (mask) are imaged onto the sample. These stripes define the wavelength of the generated acoustic waves. The mask is illuminated with a short pulse of laser light typically 1ns long, it acts as a filter so that only sound waves with the frequency to match the fixed wavelength and the velocity of the material under the patch are generated. We detect the generated surface acoustic waves (SAWs) close to the generation region. We determine the velocity by looking at the frequency of the waves we detect and our knowledge of the mask spacing.
This approach allows the determination of the velocity in a single measurement. This makes the data acquisition very fast as the laser we use has a high repetition rate. The laser in the EMDA system fires 6000 times a second, so we can perform 6000 velocity measurements per second. The final scanning rate, which includes the movement of the sample stages, data the downloading etc, is around ~1200 points/second. This is 100 times faster than previous generations of the instrument.
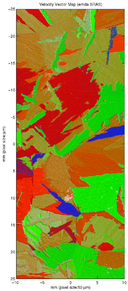
The EMDA instrument can also generate waves in any arbitrary direction as the mask can be rotated by a stepper motor. The detection spot can also be moved by use of a computer controlled piezoelectric mirror. This allows use to produce velocity surface maps or velocity vector maps without the need to rotate the sample. The instrument is being upgraded to cope with optically rough surfaces which will allow scanning to take place on a wider range of samples.
The instrument has exceptional spatial resolution and operating frequency range. Routine scans have been performed from 100-300 MHz, the design range is from 10's MHZ to 600MHz+. The spatial resolution is variable with routine measurements using 100-50 microns/pt. The high spatial resolution allows us to see very fine details in the material micro-structure.
All these capabilities have been constructed into a compact head that can be mounted above a scanning system, as pictured, or mounted directly to a scanning head. The dimensions are approximately 350x200x150 mm with an umbilical connection to a rack containing the computer and other electronics.
From Velocity to Orientation
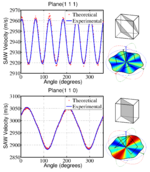
To provide orientation measurements we need to convert from velocity contrast maps to true orientation information. The acoustic velocity of a known material in a known orientation can be calculated analytically. We use a method outlined by Farnell. This method is used to calculate SAW and pseudo-SAW velocities on different crystallographic planes by using iterative search procedures and the known materials' elastic constants. The method requires iteration through different SAW velocities in a specified range to find out which velocities satisfy the boundary conditions. Using this method we can calculate the velocity surface for any crystallographic orientation.
The output from the model gives us an idea of which wave modes e.g. surface waves, pseudo surface waves and leaky modes that may propagate across a given crystallographic plane. We have to work out which of these our experiment will be sensitive to and that depends on the type of detector used. For example, our current detector is sensitive only to the out-of-plane motion of the waves, so we calculate the out of plane motion for all of the modes found during the search and choose the dominant mode. This then gives us an indication of the expected velocity surface for that crystallographic orientation that will be measured with our experiment.
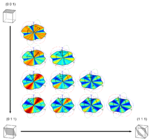
To find an orientation from experimental data we compare our experimentally obtained velocity surface to the database of velocity surfaces from all possible orientations. The orientation which most closely resembles the experimental data is then found to be the orientation of the material at the measured location.
Link to YouTube video of rotating cube/SAW velocity map for different orientations.
Determining the material elastic constants
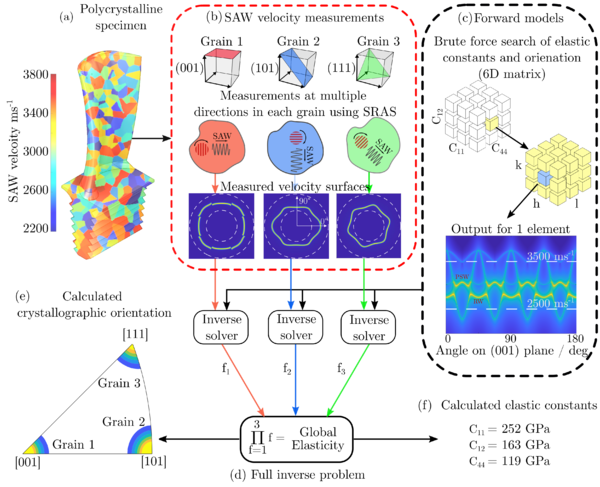
More recently, this approach has been dramatically expanded to allow the simultaneous determination of both the crystallographic orientation and elastic constants. Many engineering metals are polycrystalline; as such, the elasticity, crystalline orientation and grain distribution are cardinal factors in determining the physical properties of the material. However, the elasticity remains a more difficult parameter to measure and is rarely measured because the existing techniques are slow and cumbersome, with most current techniques requiring the laborious growth or destructive isolation of single crystals. By exploiting the global nature of the elasticity we can combine SAW velocity measurements from multiple grains to allow the determination of the single-crystal elasticity matrix (cij) and the crystallographic orientation of each grain. The process of determining both crystalline parameters is outlined in the figure.
|
Related publications
P. Dryburgh, W. Li, D. Pieris, R. Fuentes-Domínguez R. Patel, R.J. Smith, M. Clark - Measurement of the single crystal elasticity matrix of polycrystalline materials
- Acta Materialia Volume 225(117551),2022
- BibtexAuthor : P. Dryburgh, W. Li, D. Pieris, R. Fuentes-Domínguez R. Patel, R.J. Smith, M. Clark
Title : Measurement of the single crystal elasticity matrix of polycrystalline materials
In : Acta Materialia -
Address :
Date : 2022
Paul Dryburgh, Richard J. Smith, Paul Marrow, Steven J. Lainé, Steve D. Sharples, Matt Clark, Wenqi Li - Determining the crystallographic orientation of hexagonal crystal structure materials with surface acoustic wave velocity measurements
- Ultrasonics 108:106171,2020
- http://www.sciencedirect.com/science/article/pii/S0041624X20301104
BibtexAuthor : Paul Dryburgh, Richard J. Smith, Paul Marrow, Steven J. Lainé, Steve D. Sharples, Matt Clark, Wenqi Li
Title : Determining the crystallographic orientation of hexagonal crystal structure materials with surface acoustic wave velocity measurements
In : Ultrasonics -
Address :
Date : 2020
Rikesh Patel, Wenqi Li, Richard J. Smith, Steve D. Sharples, Matt Clark - Orientation imaging of macro-sized polysilicon grains on wafers using spatially resolved acoustic spectroscopy
- Scripta Materialia 140(Supplement C):67 - 70,2017
- http://www.sciencedirect.com/science/article/pii/S1359646217303846
BibtexAuthor : Rikesh Patel, Wenqi Li, Richard J. Smith, Steve D. Sharples, Matt Clark
Title : Orientation imaging of macro-sized polysilicon grains on wafers using spatially resolved acoustic spectroscopy
In : Scripta Materialia -
Address :
Date : 2017
Richard J. Smith, Wenqi Li, Jethro Coulson, Matt Clark, Michael G. Somekh, Steve D. Sharples - Spatially resolved acoustic spectroscopy for rapid imaging of material microstructure and grain orientation
- Measurement Science and Technology 25(5):055902,2014
- http://iopscience.iop.org/0957-0233/25/5/055902
BibtexAuthor : Richard J. Smith, Wenqi Li, Jethro Coulson, Matt Clark, Michael G. Somekh, Steve D. Sharples
Title : Spatially resolved acoustic spectroscopy for rapid imaging of material microstructure and grain orientation
In : Measurement Science and Technology -
Address :
Date : 2014
Richard J. Smith, Steve D. Sharples, Wenqi Li, Matt Clark, Michael G. Somekh - Orientation imaging using spatially resolved acoustic spectroscopy
- Journal of Physics: Conference Series 353:012003,2012
- http://iopscience.iop.org/1742-6596/353/1/012003
BibtexAuthor : Richard J. Smith, Steve D. Sharples, Wenqi Li, Matt Clark, Michael G. Somekh
Title : Orientation imaging using spatially resolved acoustic spectroscopy
In : Journal of Physics: Conference Series -
Address :
Date : 2012
Wenqi Li, Steve D. Sharples, Richard J. Smith, Matt Clark, Michael G. Somekh - Determination of crystallographic orientation of large grain metals with surface acoustic waves
- The Journal of the Acoustical Society of America 132(2):738--745,2012
- http://link.aip.org/link/?JAS/132/738/1
BibtexAuthor : Wenqi Li, Steve D. Sharples, Richard J. Smith, Matt Clark, Michael G. Somekh
Title : Determination of crystallographic orientation of large grain metals with surface acoustic waves
In : The Journal of the Acoustical Society of America -
Address :
Date : 2012
Business engagement
Could SRAS help your business? If you'd like us to scan one of your samples, or just to find out more about the technique, please contact wenqi.li (at) nottingham.ac.uk. We'll be very pleased to help.
