Difference between revisions of "Super-resolution imaging using nano-bells"
(→Related Publications and Talks) |
|||
| (3 intermediate revisions by the same user not shown) | |||
| Line 46: | Line 46: | ||
This process breaks down in the event of multiple particles with the same frequency of vibration being imaged in the same optical point spread function similar to when two fluorophores turn on simultaneously within one PSF in STORM. However, if the particles in each optical point spread function are sufficiently size dispersed then they can be easily and reliably imaged. Figure 4 shows a large scale image identifying many particles in a 50×50μm field of view and super-resolution images for three different positions on our sample demonstrating reliable and robust reconstruction. | This process breaks down in the event of multiple particles with the same frequency of vibration being imaged in the same optical point spread function similar to when two fluorophores turn on simultaneously within one PSF in STORM. However, if the particles in each optical point spread function are sufficiently size dispersed then they can be easily and reliably imaged. Figure 4 shows a large scale image identifying many particles in a 50×50μm field of view and super-resolution images for three different positions on our sample demonstrating reliable and robust reconstruction. | ||
| − | ==Towards more complex structures== | + | ==Towards more complex structures / Size and shape characterisation== |
| + | The phonon dynamics obtained by our technique provide all the information we need to characterise the size and shape of multiple nano-structures as we can extract their characteristic vibrational frequencies. These can be related to the real size and shape. | ||
| + | |||
| + | Representative time and frequency traces are plotted in Fig. 5(a)–(e). The frequency is extracted by a FFT after removing the electronic excitation (at t = 0) and the thermal background from the time trace. As the vibrational mode frequencies have a large range, the low frequency modes (<30 GHz) are calculated from a time trace of 0.42 ns long (blue lines); whereas, the high ones are taken from a 0.17 ns time trace (orange lines). For the case of nanorods, two main vibrational modes can be seen very clearly and due to their large aspect ratio, these frequencies are well separated. The nanorod example traces are given by a 203 × 52 nm whose frequencies are 5.15 and 45.01 GHz; and also by a 112 × 42 nm whose extensional and breathing mode are 9.06 and 55.50 GHz, respectively. Fig. 5(c) and (d) show example traces for two nano-spheres with 152 nm and 115 nm diameter where their main vibrational frequencies are 21.36 and 28.51 GHz, respectively. Finally, Fig. 5(e) shows that two frequencies are present in the same FFT; however, their values match with two nano-spheres with 138 and 102 nm (23.56 and 31.76 GHz, respectively). Although the pump laser spot is about 1 μm2, Fig. 5(e) shows two sphere vibrational modes which proves that this technique can obtain size and shape information from more than one individual nano-structure inside the same optical PSF. | ||
{|align="center" | {|align="center" | ||
| Line 53: | Line 56: | ||
|} | |} | ||
| + | All these experimental measurements match with SEM images which can be seen in the same figures. This shows that our technique agrees very well with the images taken by the electron microscope. This demonstrates that time-resolved measurements can provide the size and shape characterisation of nano-structures in a liquid surrounding medium with good agreement to SEM as well as distinguish multiple objects inside the same optical PSF. | ||
| + | |||
| + | By scanning an area with the same set-up, the size and shape characterisation of multiple metallic nano-structures is shown in Fig. 6. Each pixel of the scanned area is composed by a light intensity value (DC) and the temporal data where the vibrational modes of each nano-structure are present. The DC map (Fig. 6(a)) shows the optical image of the sample and allows the localisation of groups of nano-structures as well as defects on the specimen. From the temporal data, the vibrational frequencies can be obtained by applying a FFT as it was shown in Fig. 5. The acoustic map (or modulation depth), Fig. 6(b), is the amplitude of the largest FFT peak. Comparing the optical and acoustic maps allows the identification of any residues or defects in the sample as these can be seen optically, but they will not provide any signal in the acoustics. Furthermore, each pixel in the acoustic map can be a combination of more than one frequency, for instance, if a nano-rod or two nano-structures are present, multiple vibrational modes can coexist in the same FFT. The frequency maps were calculated by taking two different time trace lengths, 0.42 and 0.17 ns, same length as the single point measurements. The longer time trace will result in identification of the low frequency modes, i.e., the sphere and rod extensional modes shown in Fig. 6(c); whereas, for the short time trace high frequencies (rod breathing modes) will appear in Fig. 6(d). | ||
| + | |||
| + | {|align="center" | ||
| + | |[[Image:area_scan_size_shape_fig3.pdf|450px|thumb|link=|Figure 6: Size and shape characterisation data. (a) is the optical picture of a mixture of spheres and rods in an area of 40 × 40 μm2 with 0.5 μm step-size. (b) is the acoustic map. (c) is the frequency obtained by the acoustic data shown between 5 and 35 GHz (rod extensional mode and sphere main mode) and (d) is the frequency between 35 and 70 GHz (rod breathing mode). (e) Measured size and shape from as mixture of spheres (red dots) and rods (blue asterisks) given by the acoustic data. The sphere sizes are 100, 125 and 150 nm, whereas the rod length and width are 112 × 40 nm and 145 × 50 nm. The colour lines show the polydispersity of the spheres. The shaded rectangles show the polydispersity of the rods. The red dashed lines show the limitation of this technique to distinguish between a sphere and rod.]] | ||
| + | |} | ||
| + | The real sizes and shapes can be extracted using the frequency data from each pixel as demonstrated earlier. This is shown in Fig. 3(e) where the measured width and length of multiple spheres and rods are plotted. Here, the coloured squares are the polydispersity values for the rods given by the manufacturer (10%), whereas the lines are the size distribution for the spheres, 20% for 100 and 150 nm, and 4% for 125 nm. Furthermore, the red dashed lines point to the limitation of this technique to distinguish between a sphere and rod. This happens when the extensional mode cannot be measured due to signal-to-noise ratio (SNR) and frequency resolution, and only the breathing mode is present, seen in Fig. 1(b). We have estimated by finite element simulations that a nano-rod with aspect ratio between 0.9 and 1.1 cannot be differentiated from a sphere. | ||
| − | ==Related Publications | + | ==Related Publications== |
===Publications:=== | ===Publications:=== | ||
| − | ''' | + | '''Characterising the size and shape of metallic nano-structures by their acoustic vibrations'''. Rafael Fuentes-Dominguez et al, Nanoscale, 12, 14230-14236, 2020. |
| − | |||
| − | + | '''Nano ultrasonic measurements of nanoparticles'''. Rafael Fuentes-Dominguez et al, AIP Conference Proceedings, 2102, 020027, 2019. | |
| − | Super-resolution imaging using nano-bells. Rafael Fuentes-Dominguez | + | '''Super-resolution imaging using nano-bells'''. Rafael Fuentes-Dominguez et al, Scientific Reports, 8(1):16373, 2018. |
Latest revision as of 10:30, 22 October 2020
Contents
Abstract
Our group has demonstrated a new scheme for optical super-resolution, inspired, in-part, by PALM and STORM. Here each object in the field of view is tagged with a signal that allows them to be detected separately. By doing this we can identify and locate each object separately with significantly higher resolution than the diffraction limit. We demonstrated this by imaging nanoparticles significantly smaller than the optical resolution limit. In this case the "tag" we have used is the frequency of vibration of nanoscale "bells" made of metallic nanoparticles whose acoustic vibrational frequency is in the multi-GHz range. Since the vibration of the particles can be easily excited and detected and the frequency is directly related to the particle size, we can separate the signals from many particles of sufficiently different sizes even though they are smaller than, and separated by less than, the optical resolution limit. Using this scheme we have been able to localise the nanoparticle position with a precision of ~3nm. This has many potential advantages - such nanoparticles are easily inserted into cells and well tolerated, the particles do not bleach and can be produced easily with very dispersed sizes. We estimate that 50 or more different particles (or frequency channels) can be accessed in each optical point spread function using the vibrational frequencies of gold nanospheres. However, many more channels may be accessed using more complex structures (such as nanorods) and detection techniques (for instance using polarization or wavelength selective detection) opening up this technique as a generalized method of achieving super-optical resolution imaging.
How nano-bells work
In “nano-bells” (see Fig. 1), the tags are metallic nanoparticles where their optical PSF overlap in time and space and hence can not be resolved. However, it is possible to separate the PSF of each particle by measuring their vibrational signatures provided the particles are of different size and hence vibrate at a different frequency (see Fig. 1b). Determining the centroid of the point-spread function for each frequency, super-localisation can be achieved (see Fig. 1c). In “nano-bells”, we propose to use the acoustic characteristics of nanoparticles as a route for super-resolution reconstruction imaging in a similar way to STORM
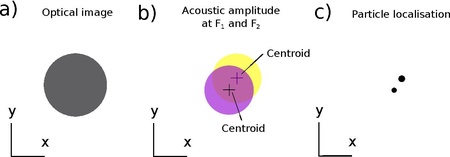 Figure 1: How nano-bells work. (a) Shows a representation of an optical image of metallic particles where the particles cannot be resolved. (b) Shows a representation of an acoustic amplitude image of the same particles at a single frequency F1 and F2. (c) Localisation of the particles from the centroids of the PSF of each frequency. The centroids obtained at frequencies F1 and F2 lead to the localisation of the particles with greater precision than the optical system used to image them. The size is obtained by the vibrational frequency of each particle. |
Experimental measurement of nanoparticle vibrations
Te experimental system consisted of an inverted microscope with additional elements mounted above the optical deck. Te sample was mounted on a positioning stage with 100 nm step size for raster scanning. Laser illumination was delivered from below using a x20 objective lens and the scattered probe light was collected above using an additional x20 objective
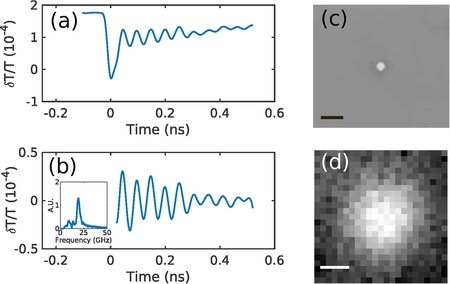
Figure 2 shows a typical signal taken from the system: (a) raw signal taken centred on the particle, (b) signal afer processing to extract the change due to scattering cross section modulation as the particle vibrates (inset frequency content), (c) SEM of the particle and (d) optical image of same particle. We can use the frequency of vibration to determine the size of the particle, in this case the size is estimated as 168±2 nm from a 18.9GHz breathing mode.
Super-localisation of multiple nano-bells
Figure 3 shows a sequence of images taken using our GHz/nanoscale phononic microscope of three particles deposited on a gridded coverslip, (a) is the optical image, (b) the SEM image of the same area, (c) the amplitude of the vibrational signal, (d) the acoustic frequency measured from the dominant peak and (e) the reconstruction of the image using (c) to locate the particles and (d) to determine their size.
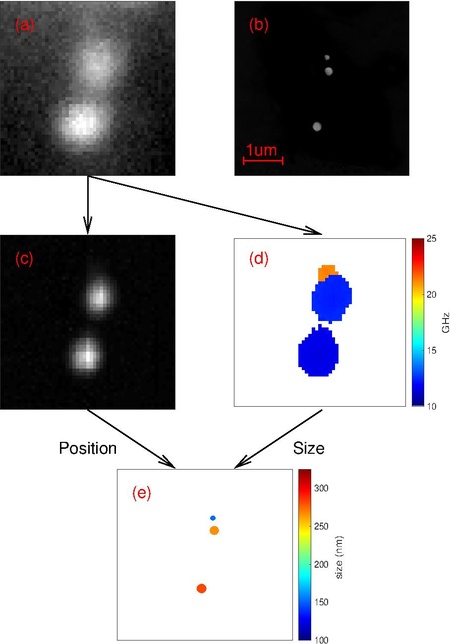 Figure 3: Images of three particles. (a) Optical image, (b) SEM, (c) acoustic amplitude, (d) acoustic frequency and (e) localisation of the particles with better precision than the diffraction limit. One is well separated from the others and can easily be resolved optically. Te other two are ~200nm apart and cannot be resolved optically, however, the acoustic signals clearly identifies the size and location of the particles allowing accurate reconstruction of the image shown in the SEM. |
In Fig. 3a the picture shows two objects well separated and because of this, one can assume their localisation is trivial by optical means. However, the SEM image of the same area (see Fig. 3b) reveals a third object not localised by optical imaging. In this case two of the three particles are close together, separated by less than the width of the optical PSF so the reconstruction becomes more complex.
Here we rely on the vibrational frequency of nano-bells to attribute, like in STORM, a unique point-spread function to each particle. Te acoustic scan provides the amplitude map of the particles which still shows only two objects (see Fig. 3c). However plotting the amplitude of each frequency present in the detected signal, lends to the reconstruction of the PSF of each particle (see Fig. 3d). Once the PSF of each particle is detected using its frequency signature, its location is determined by centroiding its PSF in a similar way to STORM (see Fig. 3e). Note that the PSF of different particles overlap although is not visible in Fig. 3d.
It can be seen that the ultrasonic reconstruction has successfully localised the nanoparticles in the sample at far higher precision than the resolution of the optical microscope is capable of. Te precision in which the size and position of the particles are localised, determined from the signal and noise analysis, can be measured to ~3nm. It is important to note that (with the exception of the SEM images) all the images presented in this paper were made through the same optics and all are constrained by the same conventional optical resolution.
 Figure 4: (Lef) 50×50μm area image showing ~150 nanoparticles and their predicted sizes where the particles are shown at 300% of their measured size for clarity at this scale. (Right) (a,c,e) SEMs of nanoparticles overlaid with their optical images and (b,d,f) SEMs of the nanoparticles shown in (a,c,e) overlaid with the acoustic reconstruction where super-optical resolution is shown. False colour in (b,d,f) indicates particle size on the same color scale as the left figure. |
This process breaks down in the event of multiple particles with the same frequency of vibration being imaged in the same optical point spread function similar to when two fluorophores turn on simultaneously within one PSF in STORM. However, if the particles in each optical point spread function are sufficiently size dispersed then they can be easily and reliably imaged. Figure 4 shows a large scale image identifying many particles in a 50×50μm field of view and super-resolution images for three different positions on our sample demonstrating reliable and robust reconstruction.
Towards more complex structures / Size and shape characterisation
The phonon dynamics obtained by our technique provide all the information we need to characterise the size and shape of multiple nano-structures as we can extract their characteristic vibrational frequencies. These can be related to the real size and shape.
Representative time and frequency traces are plotted in Fig. 5(a)–(e). The frequency is extracted by a FFT after removing the electronic excitation (at t = 0) and the thermal background from the time trace. As the vibrational mode frequencies have a large range, the low frequency modes (<30 GHz) are calculated from a time trace of 0.42 ns long (blue lines); whereas, the high ones are taken from a 0.17 ns time trace (orange lines). For the case of nanorods, two main vibrational modes can be seen very clearly and due to their large aspect ratio, these frequencies are well separated. The nanorod example traces are given by a 203 × 52 nm whose frequencies are 5.15 and 45.01 GHz; and also by a 112 × 42 nm whose extensional and breathing mode are 9.06 and 55.50 GHz, respectively. Fig. 5(c) and (d) show example traces for two nano-spheres with 152 nm and 115 nm diameter where their main vibrational frequencies are 21.36 and 28.51 GHz, respectively. Finally, Fig. 5(e) shows that two frequencies are present in the same FFT; however, their values match with two nano-spheres with 138 and 102 nm (23.56 and 31.76 GHz, respectively). Although the pump laser spot is about 1 μm2, Fig. 5(e) shows two sphere vibrational modes which proves that this technique can obtain size and shape information from more than one individual nano-structure inside the same optical PSF.
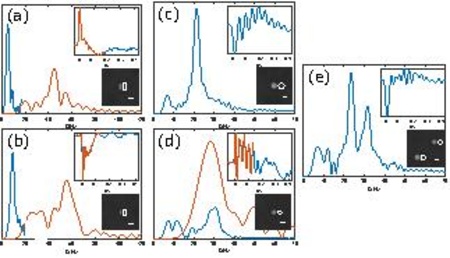 Figure 5: (a)–(e) are example raw time and Fourier transform traces (calculated after removing the electronic excitation and thermal background) of gold nanorods and spheres with different sizes including SEM pictures. The blue and orange lines are showing the long (0.42 ns) and short (0.17 ns) time traces used to calculate the low and high frequencies. (a) is a gold nanorod of 203 × 52 nm. (b) is a gold nanorod of 112 × 42 nm. (c) is a gold nanosphere of 152 nm. (d) is a gold nanosphere of 115 nm. (e) are two gold nanospheres of 102 and 138 nm. The insets are the SEM pictures (area of 1 μm2 and the bar is 100 nm) of the measured nano-structures where the reconstructed size and shape are drawn. |
All these experimental measurements match with SEM images which can be seen in the same figures. This shows that our technique agrees very well with the images taken by the electron microscope. This demonstrates that time-resolved measurements can provide the size and shape characterisation of nano-structures in a liquid surrounding medium with good agreement to SEM as well as distinguish multiple objects inside the same optical PSF.
By scanning an area with the same set-up, the size and shape characterisation of multiple metallic nano-structures is shown in Fig. 6. Each pixel of the scanned area is composed by a light intensity value (DC) and the temporal data where the vibrational modes of each nano-structure are present. The DC map (Fig. 6(a)) shows the optical image of the sample and allows the localisation of groups of nano-structures as well as defects on the specimen. From the temporal data, the vibrational frequencies can be obtained by applying a FFT as it was shown in Fig. 5. The acoustic map (or modulation depth), Fig. 6(b), is the amplitude of the largest FFT peak. Comparing the optical and acoustic maps allows the identification of any residues or defects in the sample as these can be seen optically, but they will not provide any signal in the acoustics. Furthermore, each pixel in the acoustic map can be a combination of more than one frequency, for instance, if a nano-rod or two nano-structures are present, multiple vibrational modes can coexist in the same FFT. The frequency maps were calculated by taking two different time trace lengths, 0.42 and 0.17 ns, same length as the single point measurements. The longer time trace will result in identification of the low frequency modes, i.e., the sphere and rod extensional modes shown in Fig. 6(c); whereas, for the short time trace high frequencies (rod breathing modes) will appear in Fig. 6(d).
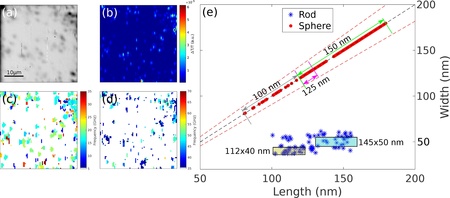 Figure 6: Size and shape characterisation data. (a) is the optical picture of a mixture of spheres and rods in an area of 40 × 40 μm2 with 0.5 μm step-size. (b) is the acoustic map. (c) is the frequency obtained by the acoustic data shown between 5 and 35 GHz (rod extensional mode and sphere main mode) and (d) is the frequency between 35 and 70 GHz (rod breathing mode). (e) Measured size and shape from as mixture of spheres (red dots) and rods (blue asterisks) given by the acoustic data. The sphere sizes are 100, 125 and 150 nm, whereas the rod length and width are 112 × 40 nm and 145 × 50 nm. The colour lines show the polydispersity of the spheres. The shaded rectangles show the polydispersity of the rods. The red dashed lines show the limitation of this technique to distinguish between a sphere and rod. |
The real sizes and shapes can be extracted using the frequency data from each pixel as demonstrated earlier. This is shown in Fig. 3(e) where the measured width and length of multiple spheres and rods are plotted. Here, the coloured squares are the polydispersity values for the rods given by the manufacturer (10%), whereas the lines are the size distribution for the spheres, 20% for 100 and 150 nm, and 4% for 125 nm. Furthermore, the red dashed lines point to the limitation of this technique to distinguish between a sphere and rod. This happens when the extensional mode cannot be measured due to signal-to-noise ratio (SNR) and frequency resolution, and only the breathing mode is present, seen in Fig. 1(b). We have estimated by finite element simulations that a nano-rod with aspect ratio between 0.9 and 1.1 cannot be differentiated from a sphere.
Related Publications
Publications:
Characterising the size and shape of metallic nano-structures by their acoustic vibrations. Rafael Fuentes-Dominguez et al, Nanoscale, 12, 14230-14236, 2020.
Nano ultrasonic measurements of nanoparticles. Rafael Fuentes-Dominguez et al, AIP Conference Proceedings, 2102, 020027, 2019.
Super-resolution imaging using nano-bells. Rafael Fuentes-Dominguez et al, Scientific Reports, 8(1):16373, 2018.
