Difference between revisions of "CMOS C35 Responsivity"
From Applied Optics Wiki
m |
m |
||
| (3 intermediate revisions by the same user not shown) | |||
| Line 1: | Line 1: | ||
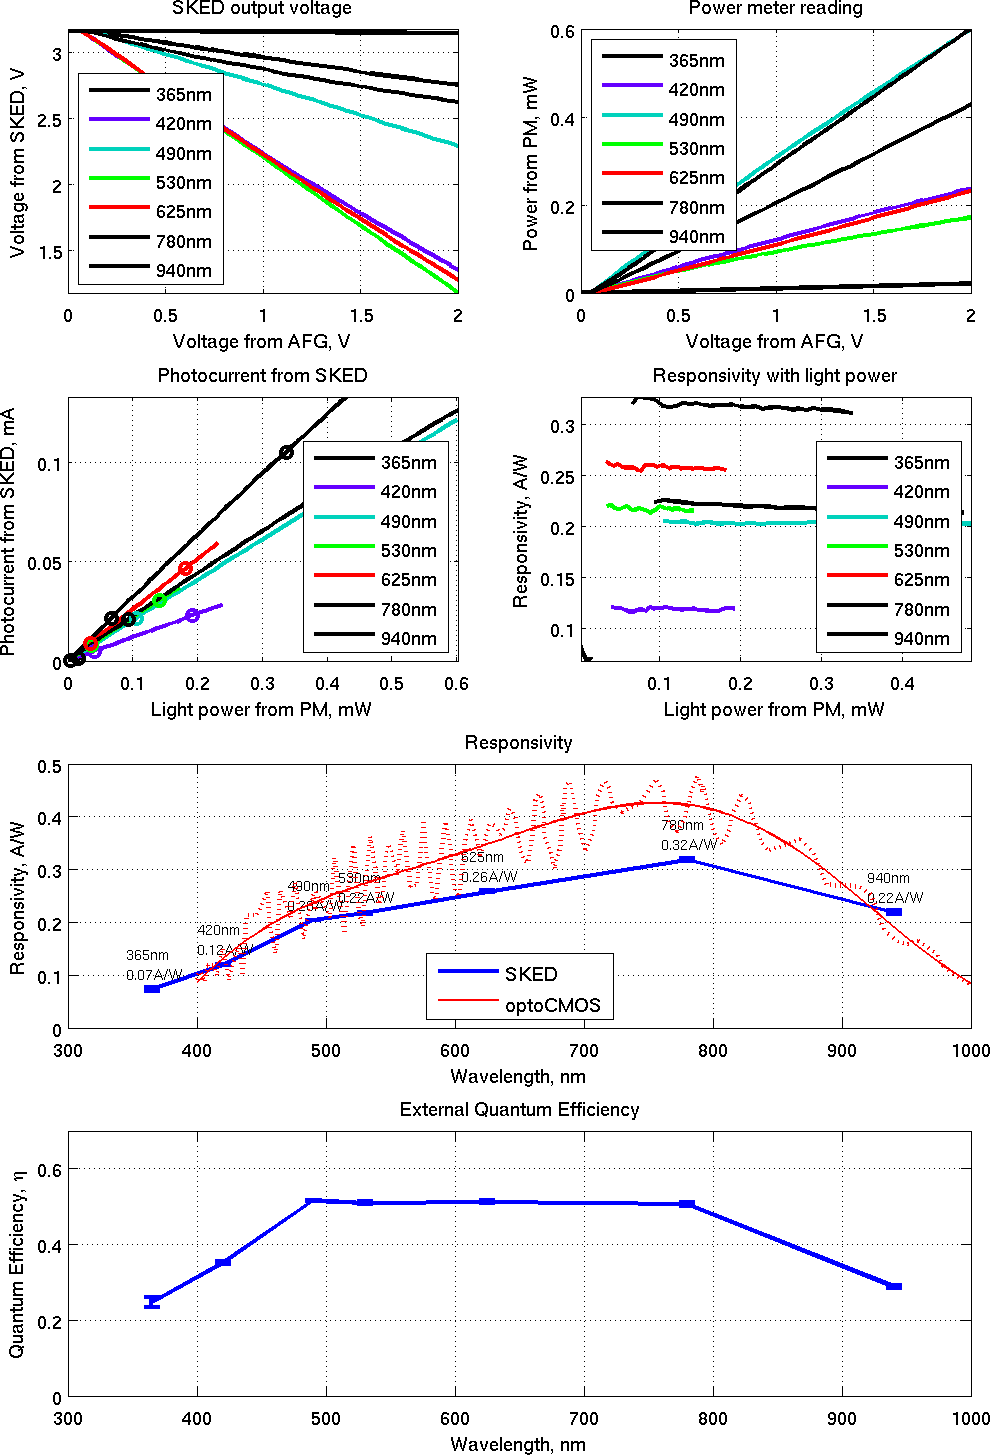
| − | + | Results from an experiment to determine the spectral responsivity of the 0.35um process we use quite a lot in this department. May be useful to other users of this process. | |
| − | Experiment was conducted on SKED1. 30kOhm load, using | + | Experiment was conducted on SKED1. 30kOhm load, using 7 hi-power LEDs from Thorlabs. For each LED, power is ramped using an AFG to ensure linearity in response. |
| − | |||
| − | |||
| − | |||
| + | There is no data from the C35 datasheet, but the related opto process gives responsivity data, and this data is overlaid on the SKED1 results (in red). The dotted line is the actual response of the optoC35 response, with a 7th order polynomial fit in the solid line. The blue line is the response of the C35 process as measured using SKED1. | ||
| + | Standard Deviation is of the order of 1mA/W. | ||
| − | + | [[File:Sked1_R.png]] | |
Latest revision as of 14:23, 18 November 2013
Results from an experiment to determine the spectral responsivity of the 0.35um process we use quite a lot in this department. May be useful to other users of this process.
Experiment was conducted on SKED1. 30kOhm load, using 7 hi-power LEDs from Thorlabs. For each LED, power is ramped using an AFG to ensure linearity in response.
There is no data from the C35 datasheet, but the related opto process gives responsivity data, and this data is overlaid on the SKED1 results (in red). The dotted line is the actual response of the optoC35 response, with a 7th order polynomial fit in the solid line. The blue line is the response of the C35 process as measured using SKED1. Standard Deviation is of the order of 1mA/W.
